Navigation
Home
User Guide
UI Overview
Program Generation
Compiling
Debugging
Additional Stuff
Hotkeys
Command Line
ASM Commands
About
|
User Guide
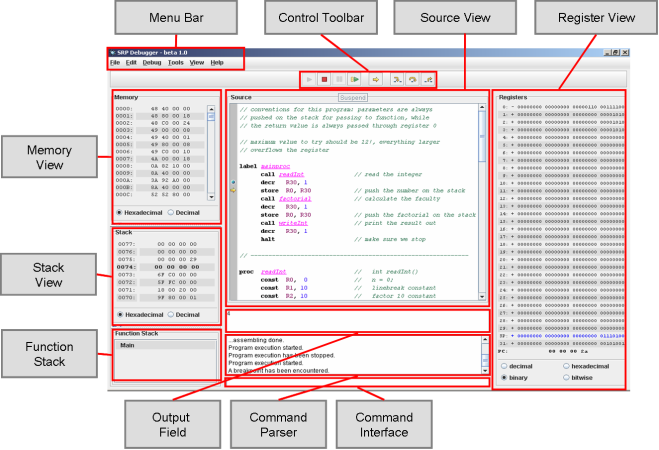
Menu Bar:
The Menu Bar provides program I/O and debugging functionality. To get an overview about the menu item's shortcuts take a look at the
hotkeys section.
File Menu:
Additionally to the basic new, open, close, save, etc... functionality the file menu contains a list holding shortcuts for
the last four successfully opened files. These files are stored persistently to be also available at a later program start.
When the user changes a currently opened file in another editor, the reload menu item refreshes the displayed content.
Edit Menu:
Basic copy, cut, paste functionality. Additionally an undo and redo manager is included.
Debug Menu:
This Menu provides all functionality for compiling and executing a program, as well as for performing all necessary debugging
actions. For more detailed information about the menu items, please take a closer look at the
debugging
chapter.
Tools Menu:
The Tools Menu currently holds a little program for an easy conversion between decimal, hexadecimal and binary numbers.
View Menu:
Sometimes it is not necessary to display all the different views in the gui. The View Menu enables the user to customize his workplace. Additionally
it provides the functionality to toggle between Syntax Highlighting and Hyperlink Help on and off.
Help Menu:
This Menu gives access to the help pages including the Javadoc files.
Control Bar:
The Control Bar consists of buttons which give easy access to the debugging menu functionality. To utilize shortcuts for these buttons please refer to
the hotkeys section.
Register View:
The Register View gives inside into the values stored in the 32 registers plus the Program Counter. The number basis of the displayed values
can be influenced by the radio buttons on the bottom.
Hint: It additionally lets the user manipulate a distinct register by performing a double click on it.
Source View:
This component is used to finally enter the asm source code. If the Syntax Highlighting in the View Menu is activated, it provides graphical
support, by distinct formatting of ASM Commands, labels, comments, and possible errors.
The dark grey box on the Source View's left hand side is the Debug Bar. It will later hold marks for breakpoints, current PC and errors.
Hint: If the Hyperlink Help mode is activated in the View Menu, you get further information about the commands entered by holding the Ctrl key
while clicking on the distinct asm command.
Memory View:
The Memory View displays the currently stored values in the processors 2^16 memory addresses. The value format again depends on the
status of the radio buttons on the bottom.
Hint: Perform a double click on a distinct memory entry and you can alter the value stored in there. The value must be entered in the format
specified by the radio buttons.
Hint: Perform a double click on any memory address and you will be able to jump to a distinct address without scrolling.
Again the value must be entered in the format specified by the radio buttons.
Stack View:
The Stack View is basically the Memory View turned upside down, since the stack grows upwards. It always centres the
memory address currently stored in the stack pointer and display it in a bold format.
It thus lets the user follow the current value stored on the stack.
Function Stack:
The Function Stack is a very useful view when working with recursions. It displays the functions currently being executed, and those that
not yet have been finished. If a function makes a recursive call, or calls another function, the called function is added below the calling function.
Consequently if one function is left, it is popped of the Function Stack.
Processor Output Field:
This view basically displays values that the processor wrote throufg its out command. It also lists the values entered into the command line wen it was in processor input mode.
Hint: Perform a right click on this view to clear all entries.
Message Log:
The Message Log displays debugging information output. The program informs the user via this widget about
compilation errors, additional debugging information, current program status, and whether the program completed successfully or not..
Hint: Perform a right click on this view to clear all entries
Command Line:
As it's name already indicates, this widget interacts as the major command interface with the user. Almost everything that can be done in the menus
can be specified by distinct commands in this command line. For a complete list of all commands please refer to the
Command Line section.
Hint: To utilize the auto completion functionality hold the Ctrl key down and press the space bar. If nothing has been entered yet
in the command interface line, you will get a complete list of all commands. If the prefix entered is ambiguous, you will get possible completions,
otherwise the completed command. This also works with the open command to get a list of all possible files, similarly as in unix systems when pressing
the TAB key.
Hint: Utilize the up - down arrow keys to scroll through your command history. A history of max. 20 commands will persistently be stored, and available
at any later program start.
When the program is running, the Command Interface will function as the input console for the processor. Whenever it turns blue, it is in that mode.
Opening a Program
There exists two types of files the Debugger properly can deal with. These first ones are the source files ( *.asm ) and second are the
binary files ( *.srp ). The *.asm files are basically plain text files, which contain the source code as you entered it into the Source View.
The ( *.srp ) files as mentioned above are binary files which contain the already assembled source code. When opening such a file, the debugger
will disassemble the content and load it into the Source View. Opening the respective ( *.srp ) file you will see, that the debugger already
has replaced e.g. call statements by the appropriate "low level procedures". Additionally, there are no more comments, and formatting whitespaces
in the disassembled source.
Hint:
When you are trying to open a file different from the above specified extension, you will be asked to specify one of to modes:
Open as source file: Choosing this option tells the debugger not to disassemble the file, but load it as plain text, even if it is a binary file.
Open as binary file (disassemble): This option lets the debugger try to disassemble the file. You will not see it's plaintext, but some arbitrarily valid asm commands.
If you do not open a valid (*.srp) file you might get syntactically correct code, but do not expect this code to be semantically correct. Execution
will very likely cause the program to result in an error.
Syntax Highlighting
The Source View provides a syntax highlighting feature for better source code structuring, early error detection, and
more convenience when developing code. It will distinguish between the following elements:
label:

command:

register:

constant:

comment:

error:

Employ the View Menu to turn this feature on or off.
Hint: To request a manual reformat perform a right click on the Source View.
Hyperlink Help
While developing code, a simple way to obtain information about a just entered command, either it's semantically meaning,
or the correct utilization of the registers, is provided by the Hyperlink Help. If activated in the View Menu
hold the Ctrl key down, and click on the command you seek for. As a result the help menu will appear, displaying
the appropriate command.
After having written a program you first need to save it, and afterwards compile it. If you do not save (update the *.asm file on disk)
before compiling, the debugger will ask you to do so. Employ the Debug Menu entries Assemble, Assemble and run, or just run
to perform this step. During this compilation process the debugger will check for syntactically erroneous code, and additionally it will gather
debugging information, necessary for later steps.
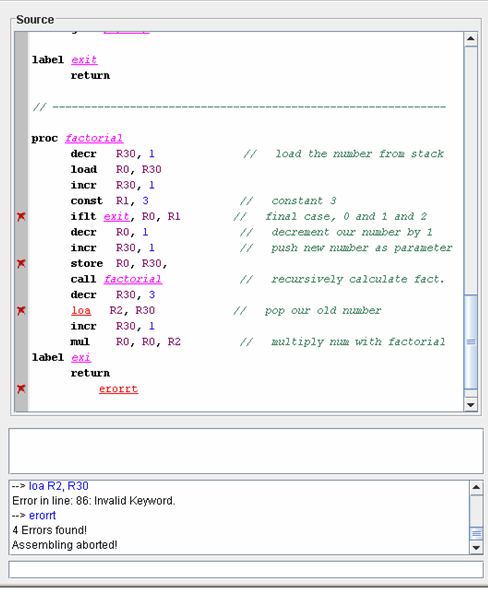
Error Discovery
If errors were encountered during the compilation process, the debugger will abort the assembling process, and display every error
in the Message Log interface. The error line number, the type of error, and the statement causing the error
will be displayed in this widget. If you take a closer look, you will see that the statements are displayed as hyperlinks. If you click on one of it,
the debugger will locate the erroneous code in the Source View and highlight it.
Check out the Debug Bar , it will sign the erroneous line in the source code with a red cross.
Possible errors categories are e.g:
- invalid number of arguments
- invalid keyword
- Label not defined in function xxx
Sample Errors:
Suppose the source code compiled successfully, you now can continue to just run or debug it.
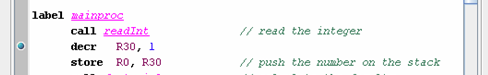
Breakpoints
Breakpoints will suspend the program at the point where the breakpoint has been set, to allow checking memory values, register values,
and stack values. The program will only continue to run at this point, when the user explicitly requests to do so.
To set a breakpoint, the user needs to put the caret into the appropriate line and press the F9 button. Alternatively
one could also double click in the appropritate line, on the Debug Bar.
Breakpoint Positioning
Theoretically you can set a breakpoint on any line, as long as the program is compiled and not running.
Nevertheless placing the breakpoint on any non code line ( including labels, comments, etc. ) does not make any sense.
When starting the program you can observe that the debugger will move these breakpoints onto the first reasonalbe code line.
You can also add breakpoint during debugging. Therefore the program status has to be in the suspended mode ( a breakpoint has
been encountered ). Here breakpoints get directly shifted to valid code lines.
 The current program counter will be indicated by an arrow on the Debug Bar.
A Breakpoint has been Encountered
The program runs until a breakpoint has been encountered, and is suspended right before this command line will be executed.
Take a look at the Message Log as it states exactly the title of this chapter.
The user now has several possibilities to move on:
Resume (F12)
 This command makes the program run until it successfully ends, an error occurs, or the next breakpoint has been encountered.
Step (F5)
This command performs one source code step in the program. The step is equivalent to the code in one source line, and does not care about
e.g. the internal representation of a call statement.
Micro Step (F6)
 In contrast to the step command, the micro step command does care about the underlying implementation of the
source code. Let us again take a closer look at the call statement. A step will perform all five "low level" commands in one
step (since this is only one source line). The micro step on the other hand, will perform for each activation exactly one "low level"
command. Hence it takes five micro step executions to complete a call statement.
In contrast to the step command, the micro step command does care about the underlying implementation of the
source code. Let us again take a closer look at the call statement. A step will perform all five "low level" commands in one
step (since this is only one source line). The micro step on the other hand, will perform for each activation exactly one "low level"
command. Hence it takes five micro step executions to complete a call statement.
Step Over (F7)
 The step over command moves through the source code as the step command. It differs when it comes to branches.
This command executes the function call all trough in one and stopes at the next line of code after e.g. the call statement.
The step over command moves through the source code as the step command. It differs when it comes to branches.
This command executes the function call all trough in one and stopes at the next line of code after e.g. the call statement.
Step Return (F8)
 The step return command completes the currently executed function as one step and moves the program counter
after the appropriate function call statement. It thus pops a complete function frame from the stack (take a look at the Function Stack).
The step return command completes the currently executed function as one step and moves the program counter
after the appropriate function call statement. It thus pops a complete function frame from the stack (take a look at the Function Stack).
Other Debugging Modi
Live Run
Live Run executes the program with a small user defined delay (in ms) between each source code line (step).
One can enable the this feature by either utilizing the Debug Menu; Live Run entry, or by typing trace < delay in ms > into the
Command Interface. To disable this feature either deselect the checkbox in the Debug Menu or type trace 0.
Hint: When performing a Live Run right from the beginning, you might wonder that the program does something,
but not executing your source code. If you take a closer look at the Function Stack you will see, that the program also
executes each loader step with the specified delay.
To overcome this, just place a breakpoint into your first source code line and run the program. When this breakpoint is encountered
and the program is in suspended mode, you can activate Live Run and specify a delay.
Watch Points
Sometimes you are not interested that the program is suspended at a certain code position, but rather when a register or memory address
changes, or holds a certain value. This is where Watch Points come into play.
When setting Watch Points by invoking the appropriate entry in the Debug Menu you will obtain a dialog box holding a table.
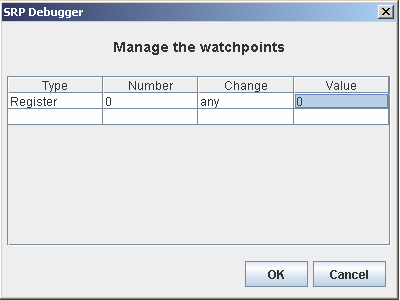
The type columns let you specify if the check is to be performed on a Register or Memory Address. Choosing the
blank entry will delete a previously entered Watch Point.
The next column Number specifies which Register or which Memory Address the Watch Point should be set on.
In the Change column you can specify the boolean expression for the test and in the last column the respective Value. If you
choose any as an boolean expression, the Value column does not have any effect, because the program is suspended on any change
of the respective Register or Memory Address.
Register Watch Points can also be set in the Command Interface. Entering watch <register number>
inserts a Watch Point with boolean expression any. Consequently the more specific command is the following:
watch < register number > relop < value >.
To delete a Watch Point just type del watch < register number >. This will erase all entries in the table with
a Watch Point on this distinct register.
Watch Points entered in the Command Interface are put in the table of the Debug Menu too. So check it to retain
an overview of all those generic breakpoints.
A conditional branch command e.g. iflt can be employed in two ways. The first parameter is a label, or the first parameter is a register.
In the latter case, the command parser will output debug information, that it switches to Register Mode. This simply means, that
the debugger directly alters the program counter and does not have to make a lookup to convert the label into a value.
|